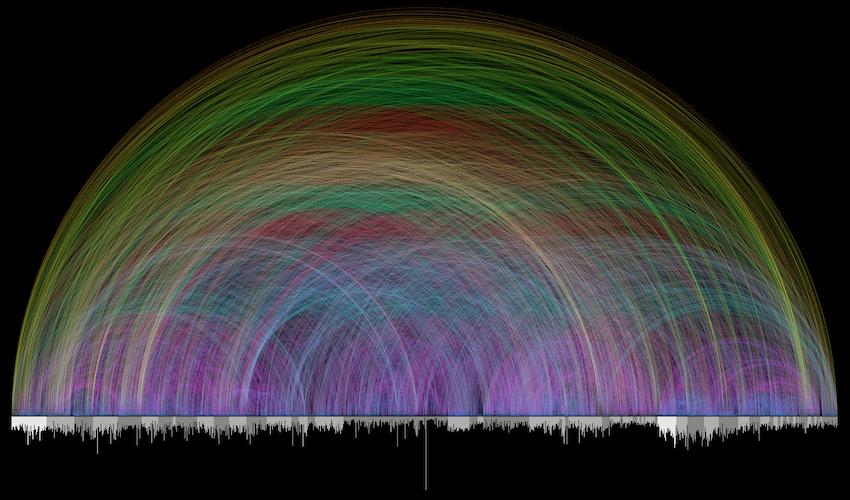
I chose this photo because it displays the miraculous interconnectedness of the library of books we call The Bible. It demonstrates design by a designer.
This depiction was designed by Chris Harrison and Christoph Römhild. This explanation is in Harrison’s own words:
“We put together a dataset of cross references found in the Bible (most often seen in study Bibles at the bottom or edges of the page, linking concepts, locations and people found in different parts of the text). Together, we struggled to find an elegant solution to render the data, more than 63,000 cross references in total. We set our sights on something more beautiful than functional. At the same time, we wanted a visualization that honored and revealed the complexity of the data at every level – as one leans in, smaller details should become visible. This ultimately led us to the multi-colored arc diagram you see below. Jordan Peterson has used this graphic in his lecture series to talk about how the Bible can be thought of as “the first hyperlinked book”.
The bar graph that runs along the bottom represents all of the chapters in the Bible (starting with Genesis 1 on the left). Books alternate in color between light and dark gray, with the first book of the Old and New Testaments in white. The length of each bar denotes the number of verses in that chapter (so for instance, the really long bar near the middle is the longest chapter in the Bible: Psalm 119). Each of the 63,779 cross references found in the Bible are depicted by a single arc – the color corresponds to the distance between the two chapters, creating a rainbow-like effect.”
https://www.chrisharrison.net/index.php/Visualizations/BibleViz
